Mobile app metrics aren’t just numbers. They’re chapters of a story:
Whether it’s the buttons users click, the time they stick around or the money they spend, each one contains vital information.
But purelylooking at them in isolation will give you a warped view of the overall narrative.
Instead, you need to piece them together – from the cover page to the blurb – to get an accurate view of your app’s success.
In this blog, we’ll help you do that. Crucially though, we’ll also help you make the changes you need to turn your app into a bestseller.
Buckle in and get scrolling 👇
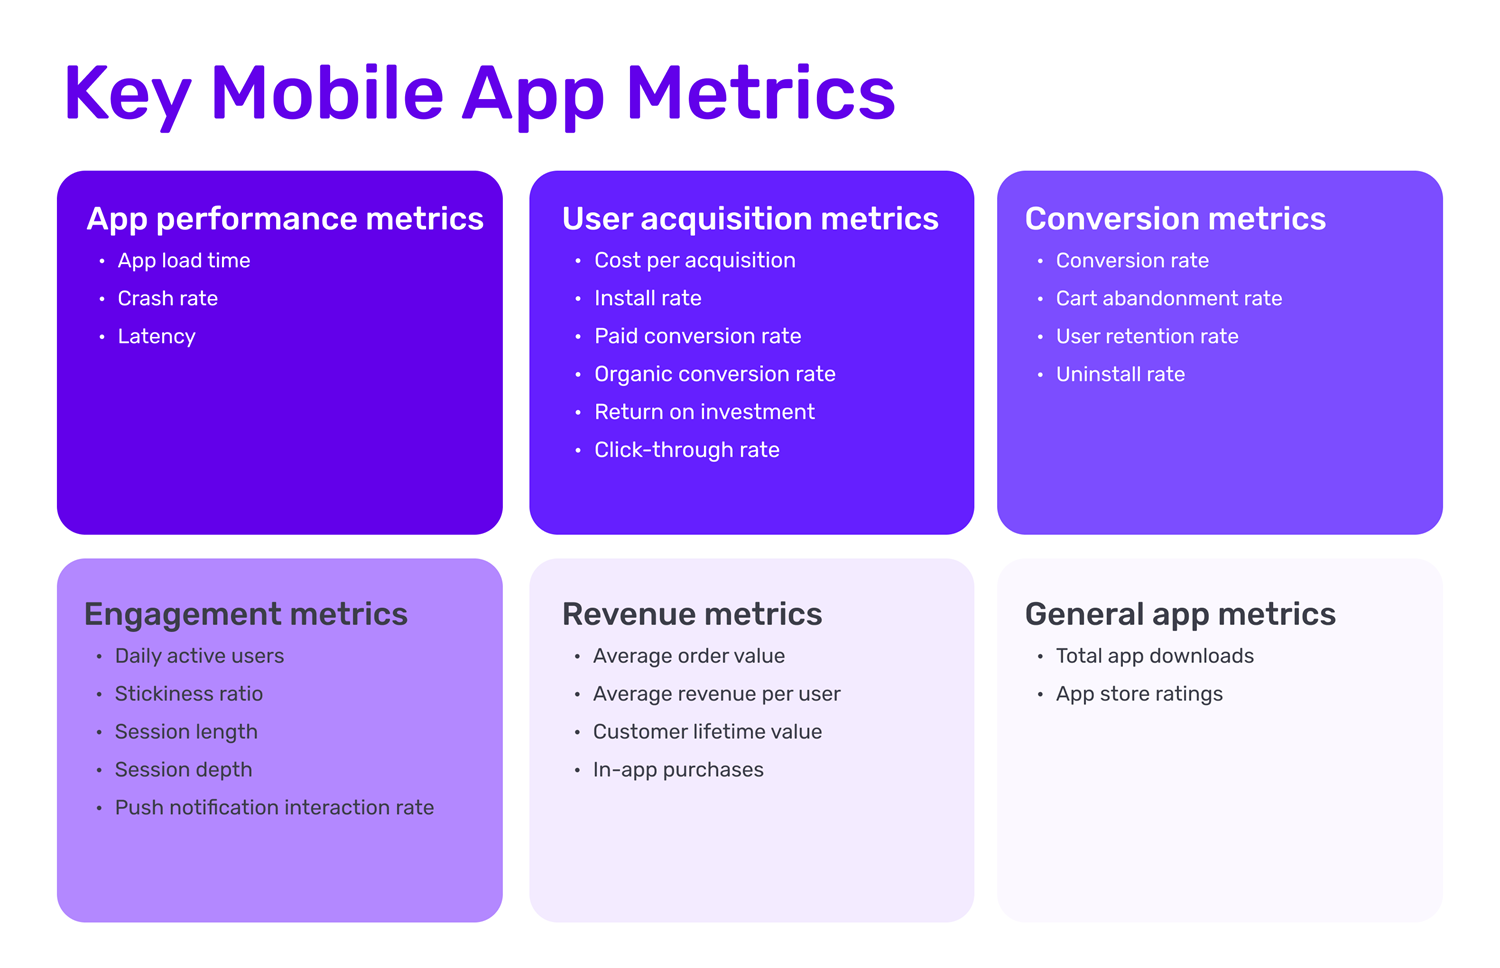
Metrics for app performance
Performance metrics are the numbers that reflect how well your app is running and how your users are experiencing it.
These metrics serve as a health checkup for your app and tell you if you need to make improvements.
1 - App load time
This metric should be at the top of your priority list if you want to deliver the best experience to your users.
Today, users want their app user experience to be smooth and fast, and if your app takes too much time to load, then they’ll not think twice about uninstalling it.
Ideally, your app load time should be 2 seconds. According to a report by Google, you should aim for under 3 seconds to display content to users.
Top tip
If you want to reduce the app load time, compress the size of your images as much as possible, but make sure that the quality of the images stays high. Keeping the file size below 100kb will ensure an optimal loading speed.
2 - Crash rate
Every app crashes at some point, but the frequency of these crashes is what you should be concerned about.
A high frequency of app crashes can be a big roadblock to your app’s success and can be considered a much bigger problem than a slow app load time. According to the ASI report, even a 1% lower stability score for an app can result in a drop of 1 whole star in app store reviews.
There are two ways you can measure your app crashes.
- App crashes per user tells you the frequency of crashes each user experiences. The benchmark you should aim for here is 1%; in other words, one crash every 100 times the user opens your app
- App crashes per sessiontells how many times your app crashed in the total number of sessions. Ideally, this number should remain less than 0.1%.
Top tip
If you want to increase the stability of your app, then prioritise app maintenance. Only by constantly monitoring and regularly updating your app to fix bugs can you reduce the crash rate.
3 - Latency
This metric tells you how fast your app responds to user interactions.
For instance, if a user clicks on a product to add it to the cart, then the API response time would be the time it takes for your app to calculate the total cost of the cart, apply discounts, confirm the availability of the size and colour and, at the same time, calculate the delivery time.
Ideally, you want it to be as minimal as possible and should aim to optimise your app for a 1 second response time.
Top tip
To decrease API response time, you should work with a fast and reliable network. It’s always best to invest in the right infrastructure so that you don’t worry about the performance of your app.
Metrics for user acquisition
User acquisition metrics are the holy grail for marketers because they tell you how effectively you’re growing your user base.
By tracking these metrics, you can make strategic changes to your marketing efforts and steer them towards accomplishing your business goals.
4 - Cost per acquisition (CPA)
Once your marketing function gets going, it's very satisfying to see your app downloads increasing. But somewhere down the line, you need to account for the money you spent on getting those instals.
CPA tracks the cost of acquiring a new user through marketing efforts. Ideally, you want to keep your CPA as low as possible, ensuring that it’s always lower than customer lifetime value (CLV).
Formula for CPA:
Cost per acquisition = Total marketing spend / Number of new users acquired |
For example, if you spent $10,000 on a new marketing campaign and acquired 2,000 new users, then your CPA is:
$10,000/2000 = $5 per user.
Ideally, a good CPA should be three times lower than the customer’s lifetime value.
Top tip
To improve your CPA, it's crucial to track the performance of your marketing strategies, recognise what is and isn’t working and discontinue ineffective campaigns. At the same time, you should always be on the lookout for cost-effective app marketing techniques with high ROI.
5 - Install rate
Install rate measures the percentage of app store visitors who actually install your app. This allows you to measure both the effectiveness of your app marketing strategies in getting users to your listing and the effectiveness of your app store optimization (ASO) strategies.
Formula for install rate:
Install conversion rate = (Number of instals / Number of page visitors) X 100 |
Top tip
To improve your install rate, you could:
- Target specific long-tail keywords with lower search volume but high relevancy i.e. “best vegan dating app” over “dating app”
- Add compelling images and videos, explaining your app benefits
- Incentivise your user base to post reviews to improve your app store ranking
6 - Paid conversion rate
This KPI measures the number of conversions generated through paid channels. This includes social media, PPC advertising, influencer marketing, events, display ads or any method that involves you spending money on impressions and instals.
As paid ads have become very expensive, this KPI helps assess the effectiveness of your paid advertising efforts and enables you to decide whether to continue, increase or stop them altogether.
Formula for paid conversion rate:
Paid conversion rate = (Number of conversions / Number of clicks on paid campaign) X 100 |
Top tip
Ideally, your paid conversion rate should be more than the organic conversion rate. If not, then invest more in organic marketing, as organic marketing, like content marketing, can generate 3X more leads compared to traditional marketing while costing 62% less.
7 - Organic conversion rate
The organic conversion rate, as the name suggests, measures the conversion of users through organic marketing.
This includes app store searches, word of mouth on social media, app store reviews, recommendations or any other medium that doesn’t involve you spending money to advertise.
This metric helps you assess how effective your app is at converting users who discover and install it naturally.
Formula for organic conversion rate:
Organic conversion rate = (Number of organic instals / Total number of instals) X 100 |
Top tip
To increase the organic conversion rate of your app, encourage your users to leave app reviews and ratings. For instance, your app could show a rating prompt after customers place an order or book an appointment.
8 - Return on investment (ROI)
Although ROI is more of a revenue metric, it can also be used as a user acquisition metric.
ROI is the ultimate indicator of your marketing efforts as you not only need to account for the app development cost but also the money you pour into acquiring new customers.
ROI tells you how much bang you’re getting for your buck. Because it’s not just about gaining new users but making sure they’re worth the investment.
Formula for ROI:
ROI = (Net profit from acquired users - Total cost of user acquisition) / Total cost of user acquisition X 100 |
Let’s understand how to calculate ROI with an example.
Imagine you spent $5,000 on a new marketing campaign and bagged 500 new users. These 500 users generated $10,000 in revenue for your business. However, to serve them, you had to spend $2,000 in operational expenses. Therefore:
Net profit from acquired users = $10,000 - $2,000 ($8000)
Total cost of user acquisition = $5,000
Your ROI will be:
($8000 - $5000) / $5000 X 100
OR
60%
This means for every dollar you spend on acquiring new users, you’re making $1.60.
ROI tells you whether your user acquisition game is on point or in need of a serious revamp.
Top tip
To increase the ROI of your app in the long run, use A/B testing. Continuously experiment with different marketing strategies to minimise the cost of user acquisition.
9 - Click-through rate (CTR)
Click-through rate is the metric that tells how irresistible your marketing efforts are. This is an important metric, as it tells you the number of people who click on your ads when they see them.
Formula for CTR:
CTR = (Number of clicks on ad / Number of impressions) X100 |
Benchmarking CTR is tricky and depends on the industry you’re in or the platform you’re using to advertise.
For instance, the average CTR for the Google display network is 0.46% across 16 industries, while for Facebook Ads it’s 0.90%.
Top tip
To increase CTR, craft compelling call-to-action buttons that invite users to press them. Use action-oriented language and communicate the value your users will get from clicking.
Want to start your app project with us?
Book a demoSpeak with one of our product experts today.
By proceeding you agree to Builder.ai’s privacy policy and terms and conditions

Metrics for conversion
Although it’s common to get confused between user acquisition and conversion metrics, they are very different from each other.
Where user acquisition metrics are all about the initial phase of attracting users, conversion metrics come into play when your users have installed your apps and focus on actions you want your users to take within the app.
10 - Conversion rate
The conversion rate is arguably the most important conversion metric. It measures the percentage of users who complete a specific action in your app, like placing an order or signing up for a newsletter.
This can also be termed the goal completion metric, where you assign anything as a goal in the user journey and can measure it for a set interval. The best part of this metric is that you can track any specific action that’s important to your business.
For one business, it could be form fills, whereas for another, it could be making a purchase.
Formula for conversion rate:
Conversion rate = (Number of users who completed desired action / Total users) X 100 |
Imagine you have 5,000 app users and 1,000 of them placed an order in October. Then the conversion rate for the month of October would be:
1,000 / 5,000 X 100 = 20% conversion rate
The conversion rate varies from industry to industry and from goal to goal. For instance, the global average ecommerce conversion rate is 2.25%, whereas the average conversion rate for professional services is 4.6%.
Top tip
If yours is a service app, then eliminate unnecessary distractions from your landing page to increase conversion rates. This will highlight your value proposition to your users. A cluttered landing page is a sure-fire way to convert fewer visitors.
However, if you have an ecommerce app, work on improving your cart abandonment rate to increase your conversion rate, which we’ll talk about now.
11 - Cart abandonment rate
The cart abandonment rate tells you how many users added items to their carts but didn’t complete the purchase.
Formula for cart abandonment rate:
Cart abandonment = (No. of carts created - No. of orders completed) / No. of carts created X 100 |
There can be many reasons why your app can see high cart abandonment rates, like shipping costs being too high, delivery being too slow and a long checkout process.
By measuring this number, you can identify potential issues in your app’s checkout process and improve conversion rates for your business.
You want to keep your cart abandonment rate as low as possible. According to the Baymard Institute, the average cart abandonment rate stood at 70% as of 2023.
Top tip
To decrease the cart abandonment rate, streamline your whole checkout process. Break down the checkout process into distinct steps with a clear progress indicator and offer your users multiple payment and shipping options.
12 - User retention rate
Not everyone will actively use your app, but some users will find value in your app and revisit it frequently. This is where the retention rate comes into play.
Formula for user retention rate:
Retention rate = (No. of users at the end of a period - No. of new users acquired during that period) / No. of users at the start X 100 |
To make this clearer, let’s say you have:
- 1,000 users at the beginning of the third quarter
- 1,500 at the end of the third quarter
- Of these 1,500, there are 800 new users
So in this case,
(1,500 - 800) /1,000 X 100 = 70%
We can say here that you have a 70% quarterly retention rate.
Depending on the business you’re in, you need to calculate retention rates over a realistic timeline. For example, a hotel booking app shouldn’t yaw weekly retention rates as the same people don’t tend to use them as often. Instead, they should calculate retention rate on a yearly basis.
On the other hand, ecommerce apps selling low-cost goods should look out for monthly retention rates, as people tend to use them more often.
So what’s a good retention rate, you ask? Ideally, a good retention rate should range anywhere between 10-30%.
13 - Uninstall rate
Losing users after spending so much time and effort to get them to download your app is a bitter pill to swallow.
And while it is an inevitability you need to make peace with, you should try to keep your uninstall rate as low as possible.
After all, a high one means your app isn’t quite meeting user expectations or performing the tasks they expect it to do well enough.
Formula for uninstall rate:
Uninstall rate = No. of uninstalls / Total no. instals X 100 |
Globally, the overall 30-day uninstall rate stands at 28% for mobile apps worldwide.
However, one thing this metric lacks is that it doesn’t pinpoint the area for a high churn. As a result, it should be used alongside engagement metrics, which we’ll dive into now 👇
Metrics for engagement
Engagement metrics measure whether or not your app hooks and provides value to your users.
The higher these numbers are for your app, the more your app becomes an integral part of your user's lives. The lower these numbers, the higher the uninstals.
14 - Daily active users (DAU)
DAU is the most important metric for tracking the number of users who actively open or engage your app on a daily basis.
There’s no formula to calculate it, just the number of unique users who used your app on a specific day.
It’s understandable that not all apps need to be opened every day, so depending on your business, you can track weekly active users (WAU), monthly active users (MAU) or average daily active users (ADAU).
For instance, if you have a healthcare app that reminds users to take pills every day, then track DAU. If you’re in the financial sector, then tracking MAU makes more sense.
Top tip
To increase daily active users, keep things fresh by adding new features and content, based on user feedback.
15 - Stickiness ratio
Stickiness ratio measures how frequently and consistently your users engage with your app.
This metric takes into account both daily active users (DAU) and monthly active users (MAU) to measure how many users keep coming back to your app regularly.
Formula for stickiness ratio:
Stickiness ratio = Daily active users / monthly active users X 100 |
For example, if you have 500 daily active users and your monthly active users are 10,000, then your stickiness ratio is:
500 / 10000 X 100 = 5%
The higher the number of this ratio, the stickier your app is. A sticky ratio indicates that your app has succeeded in making your users return frequently and you can be much more profitable.
Usually, a stickiness ratio over 20% is considered good. If you’re scoring 50% or higher, then you’re in the Facebook category, which is impressively high.
Top tip
To increase stickiness, focus on personalising app user experience by sending segmented push notifications and recommending relevant products and content.
16 - Session length
Session length is the engagement metric that measures the average amount of time a single user spends within your app.
In other words, you see how long your app is able to deliver value to your users. However, there’s a caveat:
If your app is primarily an information source, then high session length is positive. On the contrary, an ecommerce business may be happy with a shorter session length as long as their users are converting.
Top tip
Session length alone can be quite a confusing metric and should be used with session depth to get a clear picture. Session length can also be used in conjunction with metrics like app load time, crashes and uninstalls, so you can work out if there are any correlations.
17 - Session depth
Session depth tracks the number of pages or screens the user visits in one session.
The higher the session depth, the more the user is engaging with the app. However, this can also mean it’s taking too long to navigate through your app to take the desired action.
Session depth, along with the session length, tells you the effectiveness of your app’s user interface and design and, at the same time, helps you identify areas for improvement in the user experience.
18 - Push notification interaction rate (PNIR)
Push notification interaction rate is an engagement metric that measures how users respond to the push notifications sent by your app.
This metric is a bit tricky.
Yes, it tells you the level of engagement with your notifications, but this rate can take a serious hit if you bombard users with notifications. Worse, users may stop actively using your app or uninstall it completely if you do so.
Formula for push notification interaction rate:
PNIR = (No. of users who interacted with notification / Total no. of notifications sent) X 100 |
To maintain a healthy push notification interaction rate, you need to keep the denominator – i.e. the total number of notifications sent – relatively low. You can do this by following best practices for push notifications.
The ideal number for this metric varies for different industries and platforms. iOS has a push notification interaction rate of 3.4%, whereas Android has a rate of 4.6%.
Top tip
To increase PNIR, use rich push notifications, which allow you to add media such as photos and videos, enticing users to click on them.
Metrics for revenue
It’s time to talk about (arguably) the most important thing of all:
Cash money.
Revenue metrics are like your financial scoreboard, which tell you whether your app is financially sustainable.
Let’s dive in 👇
19 - Average order value (AOV)
Average order value is a gold standard metric when it comes to ecommerce businesses. This metric tells you how much money users spend on each transaction or order in your app.
Once you know the AOV you can evaluate your marketing and pricing strategies. If your app can’t increase the number of users, you should try to increase the average order value so that it can increase your total revenue.
Formula for average order value:
Average order value = Total revenue generated / Number of orders |
You can increase your AOV by using strategies like product bundling, upselling, loyalty programs, volume discounts and more.
It’s important to note that mindlessly trying to increase AOV can reduce the number of users of your app. So the goal should be to enhance the overall customer experience to achieve a win-win for both.
Top tip
A great way to increase the average order value is to offer free shipping after a certain threshold. For instance, free shipping on purchases of over $100. This makes users buy more to sweeten the deal.
20 - Average revenue per user (ARPU)
Unlike AOV, which talks about individual transactions, ARPU provides a broad overview of revenue generated by considering all transactions.
ARPU calculates the average amount of revenue generated from each user of your app over a specified period. Typically, ARPU is best suited for businesses that work on subscription-based models.
Here’s the formula for average revenue per user:
ARPU = Total revenue generated / Total number of users |
In many ways, ARPU is somewhat related to customer lifetime value (CLTV), as they both revolve around value generated by users. But ARPU is a short-term metric that measures average revenue per user over a weekly, monthly or yearly time period.
On the other hand, CLTV calculates the expected revenue a customer will generate over their entire journey with your business.
Top tip
Many established businesses are using a subscription model along with selling their products to increase their ARPU. For instance, Amazon is selling Prime memberships and Apple is selling Apple Care.
The subscription model works well for frequently used, fast-expiring products like healthcare, home maintenance and food delivery. Look out for such opportunities within your business.
21 - Customer lifetime value (CLTV)
No, ARPU and CLTV are not the same. However, ARPU is part of CLTV.
Confused? Hopefully not for long. Check out the CLTV formula and you’ll know what I’m saying.
Formula for customer lifetime value:
CLTV = Average revenue per user (ARPU) X Average customer lifespan |
Customer lifetime value is a longer-term metric that quantifies the total revenue a customer will generate for your business over the entire duration of the relationship.
CLTV helps you understand the long-term value of your customer base and enables you to make decisions to retain them. Once you aim to increase the CLTV of your business, you start working towards providing maximum value to your customers so that they stick with you for longer.
Top tip
To increase the CLTV of your app, offer quality customer service. Great customer service equals better customer experiences, which leads to a high customer lifespan.
22 - In-app purchases
If you’re using app monetization strategies for in-app purchases like virtual items, premium content, subscriptions or additional features, then this metric should be one of your top KPIs to track.
In-app purchases track the total revenue generated by users within the app. Monitoring this metric quantifies whether your app users are spending money or just want to use it for free.
Based on this metric, you can make informed decisions to provide more value to your users and refine your pricing and offerings to encourage more users to make purchases within your app.
Top tip
If in-app purchases are the lifeblood of your business, like games, then you can remove the entry barrier to your app and let your users download it for free. This way, you can lure your users with new, shiny things.
Whereas, if your primary business is to sell the app, like a professional video editing app or stock trading app, then IAPs, albeit being a bonus revenue stream, may not be as popular with users.
General app metrics
While these metrics don’t provide insights into the inner workings of your app, they do give you the top-level information you need to see whether your app is on the right track.
Let’s dive in 👇
23 - Total app downloads
Total downloads, as the name suggests, are the cumulative number of times your app has been downloaded. These numbers can be tracked from app stores and can give you a fair idea of your app’s popularity.
However, total downloads don’t represent the total number of engagements or users retained. They also doesn’t tell you how much revenue your app generates.
Top tip
A top tip to increase your app downloads is to reach out to relevant influencers in your niche and encourage them to share a review of your app with their community.
24 - App store ratings and reviews
Maintaining high mobile app store ratings is one thing you should definitely work on, as almost 50% of users won’t even consider downloading your app if it has 3 stars or less.
And the anecdotal feedback users provide, combined with the data we’ve mentioned above, will help you inform the future development roadmap of your app.
Replying to reviews, whether positive or negative, helps to keep users in the loop and show you’re actively working on addressing their concerns.
Top tip
Encourage your users to post a positive review whenever they successfully complete an action on your app. For instance, an ecommerce app can ask for a positive rating after your users have placed their order or when a product is delivered to them.
Conclusion
As you can see, reading the whole story (and not just the prelude) is the key to correctly interpreting your mobile app metrics.
Once you have that, you can identify the plot points that need to be improved and the characters that need some extra TLC.
For more app insights, hit the banner below to join our community👇
Want to start your app project with us?
Book a demoSpeak with one of our product experts today.
By proceeding you agree to Builder.ai’s privacy policy and terms and conditions
Ridhima is the Global Head of Marketing at Builder.ai. With 16+ years of experience in delivering data-driven, strategic marketing campaigns, Ridhima’s innovative approach has accelerated growth within the marketing and content teams.


 Facebook
 X
X LinkedIn
 YouTube
 Instagram
 RSS
RSS